
Introduction to Netstat Commands on Linux
Netstat (Network Statistics) is a helpful command-line utility available in Linux for monitoring and analysis of networking connections, routing tables, and performance. It also offers detailed information about open ports, listening sockets, and active connections, which can be crucial for network troubleshooting and security monitoring. Netstat is of utmost importance for system administrators who seek to manage Linux network environments
Features of the Netstat Command
Connection Information: Display information about all active and listening network connections, including protocol type, local/remote addresses, and connection states.
Port Analysis: See what services or processes are listening on certain ports.
Routing Information: Show the routing table from the system, important to know how data packets are being routed.
Protocol Stats: 4 – 6 steps Protocol statistics gives the performance data of protocols such as TCP, UDP, ICMP. Including the number of sent packets, received packets, Input errors, Output errors.
List of Netstat Commands with examples
1. An overview of all TCP and UDP connections LISTENING
Listing all TCP and UDP ports using the netstat -a option.
# netstat -a | more
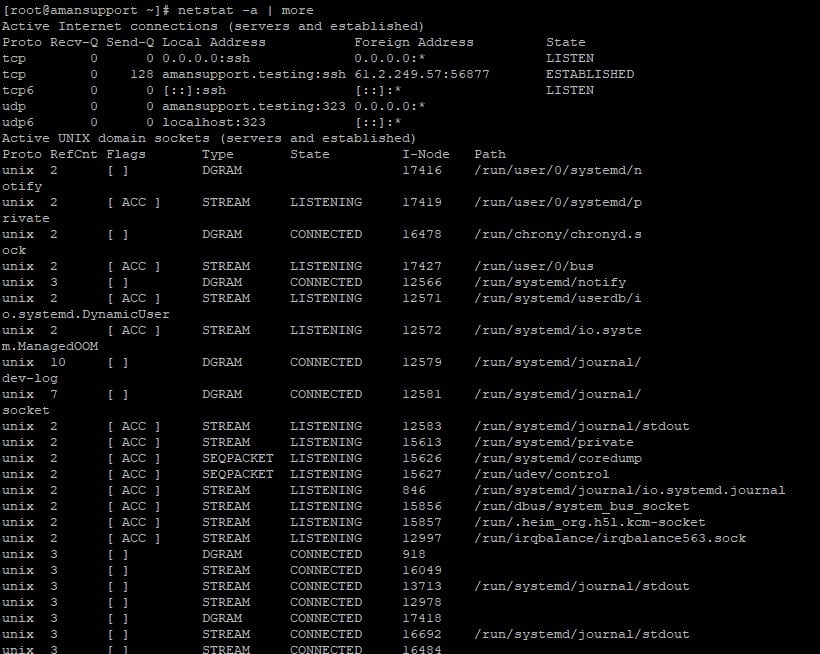
[root@support ~]# netstat -a | more
Active Internet connections (servers and established)
|
Proto |
Recv-Q |
Send-Q |
Local Address |
Foreign Address |
State |
|---|---|---|---|---|---|
|
tcp |
0 |
0 |
0.0.0.0:ssh |
0.0.0.0:* |
LISTEN |
|
tcp |
0 |
128 |
support.testing:ssh |
61.2.249.57:56877 |
ESTABLISHED |
|
tcp6 |
0 |
0 |
[::]:ssh |
[::]:* |
LISTEN |
Active UNIX domain sockets (Servers and established)
|
Proto |
RefCnt |
Flags |
Type |
State |
I-Node |
Path |
|---|---|---|---|---|---|---|
|
unix |
2 |
[ ACC ] |
STREAM |
LISTENING |
12572 |
/run/systemd/io.system.ManagedOOM |
|
unix |
10 |
[ ] |
DGRAM |
CONNECTED |
12579 |
/run/systemd/journal/dev-log |
|
unix |
7 |
[ ] |
DGRAM |
CONNECTED |
12581 |
/run/systemd/journal/ |
|
unix |
2 |
[ ACC ] |
SEQPACKET |
LISTENING |
15627 |
/run/udev/control |
|
unix |
2 |
[ ACC ] |
STREAM |
LISTENING |
846 |
/run/systemd/journal/io.systemd.journal |
|
unix |
2 |
[ ACC ] |
STREAM |
LISTENING |
15856 |
/run/dbus/system_bus_socket |
|
unix |
2 |
[ ACC ] |
STREAM |
LISTENING |
15857 |
/run/.heim_org.h5l.kcm-socket |
|
unix |
2 |
[ ACC ] |
STREAM |
LISTENING |
12997 |
/run/irqbalance/irqbalance563.sock |
2. Listing TCP Ports connections
netstat usage -at to show only TCP (Transmission Control Protocol) port connections.
# netstat -at
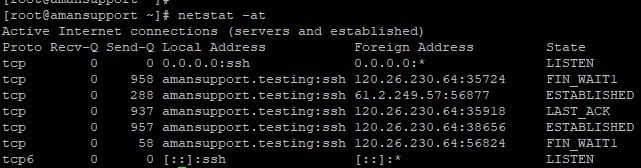
[root@support ~]# netstat -at
Active Internet connections (servers and established)
|
Proto |
Recv-Q |
Send-Q |
Local Address |
Foreign Address |
State |
|---|---|---|---|---|---|
|
tcp |
0 |
0 |
0.0.0.0:ssh |
0.0.0.0:* |
LISTEN |
|
tcp |
0 |
958 |
support.testing:ssh |
120.26.230.64:35724 |
FIN_WAIT1 |
|
tcp |
0 |
288 |
support.testing:ssh |
61.2.249.57:56877 |
ESTABLISHED |
|
tcp |
0 |
937 |
support.testing:ssh |
120.26.230.64:35918 |
LAST_ACK |
|
tcp |
0 |
957 |
support.testing:ssh |
120.26.230.64:38656 |
ESTABLISHED |
|
tcp |
0 |
58 |
support.testing:ssh |
120.26.230.64:56824 |
FIN_WAIT1 |
|
tcp6 |
0 |
0 |
[::]:ssh |
[::]:* |
LISTEN |
3. Listing UDP Ports connections
netstat usage -au, this command lists only UDP (User Datagram Protocol ) port connections.
# netstat -au
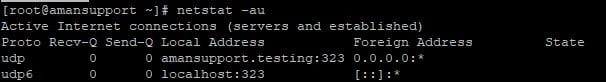
[root@support ~]# netstat -au
Active Internet connections (servers and established)
|
Proto |
Recv-Q |
Send-Q |
Local Address |
Foreign Address |
State |
|---|---|---|---|---|---|
|
udp |
0 |
0 |
support.testing:323 |
0.0.0.0:* |
|
|
udp6 |
0 |
0 |
localhost:323 |
[::]:* |
4. Listing all LISTENING Connections
Netstat -l displays all active listening port connections.
# netstat -l
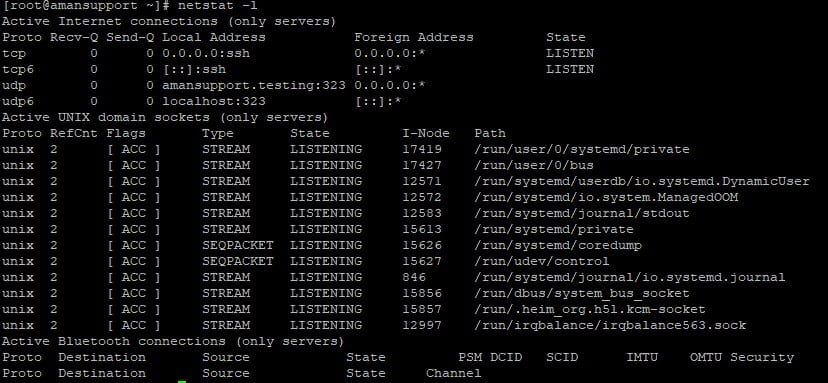
[root@support ~]# netstat -l
Active Internet connections (only servers)
|
Proto |
Recv-Q |
Send-Q |
Local Address |
Foreign Address |
State |
|---|---|---|---|---|---|
|
tcp |
0 |
0 |
0.0.0.0:ssh |
0.0.0.0:* |
LISTEN |
|
tcp6 |
0 |
0 |
[::]:ssh |
[::]:* |
LISTEN |
Active UNIX domain sockets (only servers)
|
Proto |
RefCnt |
Flags |
Type |
State |
I-Node |
Path |
|---|---|---|---|---|---|---|
|
unix |
2 |
[ ACC ] |
STREAM |
LISTENING |
12583 |
/run/systemd/journal/stdout |
|
unix |
2 |
[ ACC ] |
STREAM |
LISTENING |
846 |
/run/systemd/journal/io.systemd.journal |
|
unix |
2 |
[ ACC ] |
STREAM |
LISTENING |
15856 |
/run/dbus/system_bus_socket |
|
unix |
2 |
[ ACC ] |
STREAM |
LISTENING |
15857 |
/run/.heim_org.h5l.kcm-socket |
|
unix |
2 |
[ ACC ] |
STREAM |
LISTENING |
12997 |
/run/irqbalance/irqbalance563.sock |
Proto Destination Source State PSM DCID SCID IMTU OMTU Security
Proto Destination Source State Channel
5. Listing all TCP Listening Ports
Use the option netstat -lt to list all active TCP ports.
# netstat -lt
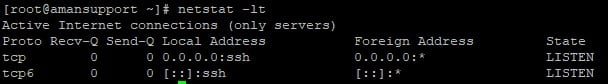
[root@support ~]# netstat -lt
Active Internet connections (only servers)
|
Proto |
Recv-Q |
Send-Q |
Local Address |
Foreign Address |
State |
|---|---|---|---|---|---|
|
tcp |
0 |
0 |
0.0.0.0:ssh |
0.0.0.0:* |
LISTEN |
|
tcp6 |
0 |
0 |
[::]:ssh |
[::]:* |
LISTEN |
6. Listing all UDP Listening Ports
The option netstat -lu lists all UDP ports that are actively listening.
# netstat -lu
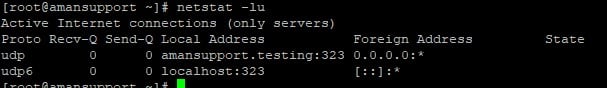
[root@support ~]# netstat -lu
Active Internet connections (only servers)
|
Proto |
Recv-Q |
Send-Q |
Local Address |
Foreign Address |
State |
|---|---|---|---|---|---|
|
udp |
0 |
0 |
amansupport.testing:323 |
0.0.0.0:* |
|
|
udp6 |
0 |
0 |
localhost:323 |
[::]:* |
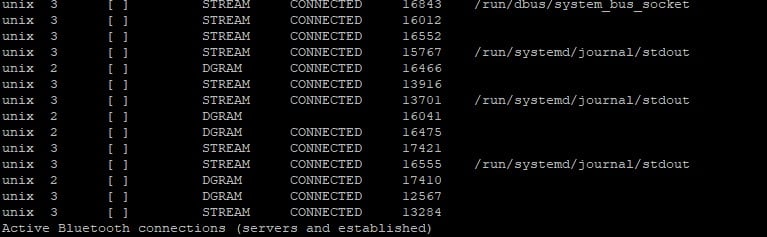
7. Listing all UNIX Listening Ports
Listing all active UNIX listening ports using netstat -lx.
# netstat -lx
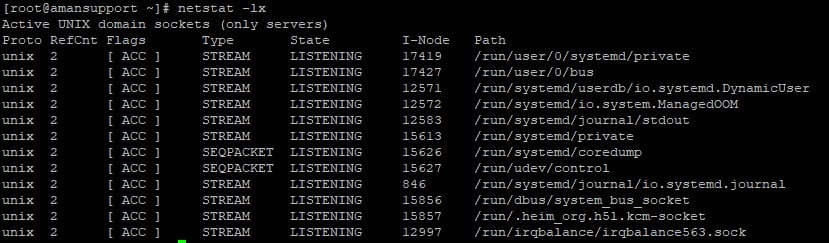
[root@support ~]# netstat -lx
Active UNIX domain sockets (only servers)
|
Proto |
RefCnt |
Flags |
Type |
State |
I-Node |
Path |
|---|---|---|---|---|---|---|
|
unix |
2 |
[ ACC ] |
STREAM |
LISTENING |
17419 |
/run/user/0/systemd/private |
|
unix |
2 |
[ ACC ] |
STREAM |
LISTENING |
17427 |
/run/user/0/bus |
|
unix |
2 |
[ ACC ] |
STREAM |
LISTENING |
12571 |
/run/systemd/userdb/io.systemd.DynamicUser |
|
unix |
2 |
[ ACC ] |
STREAM |
LISTENING |
12572 |
/run/systemd/io.system.ManagedOOM |
|
unix |
2 |
[ ACC ] |
STREAM |
LISTENING |
12583 |
/run/systemd/journal/stdout |
|
unix |
2 |
[ ACC ] |
STREAM |
LISTENING |
15613 |
/run/systemd/private |
|
unix |
2 |
[ ACC ] |
SEQPACKET |
LISTENING |
15626 |
/run/systemd/coredump |
|
unix |
2 |
[ ACC ] |
SEQPACKET |
LISTENING |
15627 |
/run/udev/control |
|
unix |
2 |
[ ACC ] |
STREAM |
LISTENING |
846 |
/run/systemd/journal/io.systemd.journal |
|
unix |
2 |
[ ACC ] |
STREAM |
LISTENING |
15856 |
/run/dbus/system_bus_socket |
|
unix |
2 |
[ ACC ] |
STREAM |
LISTENING |
15857 |
/run/.heim_org.h5l.kcm-socket |
|
unix |
2 |
[ ACC ] |
STREAM |
LISTENING |
12997 |
/run/irqbalance/irqbalance563.sock |
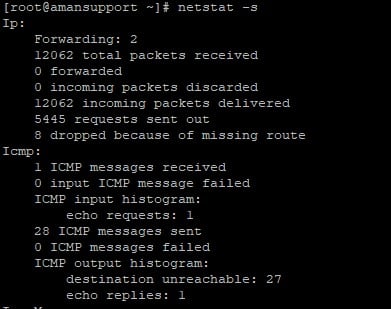
8. Showing Statistics by Protocol
Displays statistics by protocol. By default, statistics are shown for the TCP, UDP, ICMP, and IP protocols. The -s parameter can be used to specify a set of protocols.
# netstat -s
[root@support ~]# netstat -s
Ip:
Forwarding: 2
12062 total packets received
0 forwarded
0 incoming packets discarded
12062 incoming packets delivered
5445 requests sent out
8 dropped because of missing route
Icmp:
1 ICMP messages received
0 input ICMP message failed
ICMP input histogram:
echo requests: 1
28 ICMP messages sent
0 ICMP messages failed
ICMP output histogram:
destination unreachable: 27
echo replies: 1
Showing statistics of only TCP protocol by using option netstat -st.
# netstat -st

[root@support ~]# netstat -st
IcmpMsg:
InType8: 2
OutType0: 2
OutType3: 27
Tcp:
21 active connection openings
11 passive connection openings
4 failed connection attempts
3 connection resets received
2 connections established
8150 segments received
10. Showing Statistics by UDP Protocol
# netstat -su
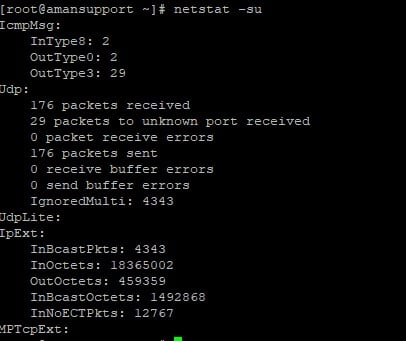
[root@support ~]# netstat -su
IcmpMsg:
InType8: 2
OutType0: 2
OutType3: 29
Udp:
176 packets received
29 packets to unknown port received
0 packet receive errors
176 packets sent
0 receive buffer errors
0 send buffer errors
IgnoredMulti: 4343
UdpLite:
IpExt:
InBcastPkts: 4343
InOctets: 18365002
OutOctets: 459359
InBcastOctets: 1492868
InNoECTPkts: 12767
MPTcpExt:
11. Displaying Service name with PID
Displaying service name with their PID number, using option netstat -tp will display “PID/Program Name“
# netstat -tp

[root@support ~]# netstat -tp
Active Internet connections (w/o servers)
|
Proto |
Recv-Q |
Send-Q |
Local Address |
Foreign Address |
State |
PID/Program name |
|---|---|---|---|---|---|---|
|
tcp |
0 |
96 |
support.testing:ssh |
61.2.249.57:26813 |
ESTABLISHED |
907/sshd: root [pri |
|
tcp |
0 |
0 |
support.testing:ssh |
61.2.249.57:56877 |
ESTABLISHED |
787/sshd: root [pri |
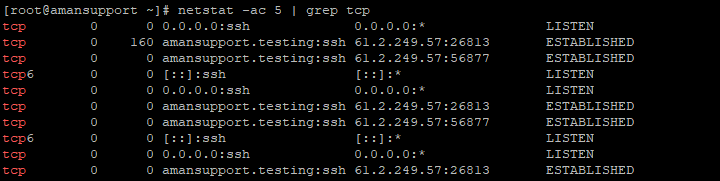
12. Displaying Promiscuous Mode
When using the -ac switch, you can display promiscuous mode or refresh the screen every five seconds. It is set to refresh every second by default.
# netstat -ac 5 | grep tcp
|
tcp |
0 |
0 |
0.0.0.0:ssh |
0.0.0.0:* |
LISTEN |
|
tcp |
0 |
160 |
support.testing:ssh |
61.2.249.57:26813 |
ESTABLISHED |
|
tcp |
0 |
0 |
support.testing:ssh |
61.2.249.57:56877 |
ESTABLISHED |
|
tcp6 |
0 |
0 |
[::]:ssh |
[::]:* |
LISTEN |
|
tcp |
0 |
0 |
0.0.0.0:ssh |
0.0.0.0:* |
LISTEN |
|
tcp |
0 |
0 |
support.testing:ssh |
61.2.249.57:26813 |
ESTABLISHED |
|
tcp |
0 |
0 |
support.testing:ssh |
61.2.249.57:56877 |
ESTABLISHED |
|
tcp6 |
0 |
0 |
[::]:ssh |
[::]:* |
LISTEN |
13. Displaying Kernel IP routing
With the netstat and route commands, you can display the kernel IP routing table.
# netstat -r
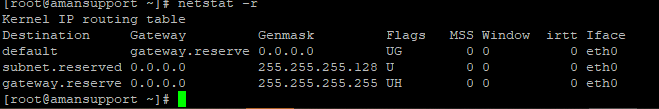
[root@support ~]# netstat -r
Kernel IP routing table
|
Destination |
Gateway |
Genmask |
Flags |
MSS |
Window |
irtt |
Iface |
|---|---|---|---|---|---|---|---|
|
default |
gateway.reserve |
0.0.0.0 |
UG |
0 |
0 |
0 |
eth0 |
|
subnet.reserved |
0.0.0.0 |
255.255.255.128 |
U |
0 |
0 |
0 |
eth0 |
|
gateway.reserve |
0.0.0.0 |
255.255.255.255 |
UH |
0 |
0 |
0 |
eth0 |
14. Showing Network Interface Transactions
Displays both the transferring and receiving packet transactions for the network interface.
# netstat -i
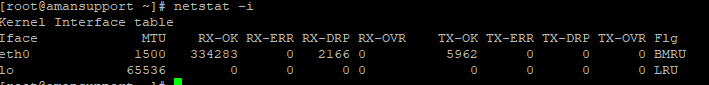
[root@support ~]# netstat -i
Kernel Interface table
|
Iface |
MTU |
RX-OK |
RX-ERR |
RX-DRP |
RX-OVR |
TX-OK |
TX-ERR |
TX-DRP |
TX-OVR |
Flg |
|---|---|---|---|---|---|---|---|---|---|---|
|
eth0 |
1500 |
334283 |
0 |
2166 |
0 |
5962 |
0 |
0 |
0 |
BMRU |
|
lo |
65536 |
0 |
0 |
0 |
0 |
0 |
0 |
0 |
0 |
LRU |
15. Showing Kernel Interface Table
Like ifconfig, this command displays the kernel interface table.
# netstat -ie
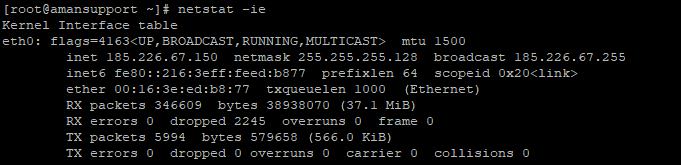
[root@support ~]# netstat -ie
Kernel Interface table
eth0: flags=4163<UP,BROADCAST,RUNNING,MULTICAST> mtu 1500
inet 185.226.67.150 netmask 255.255.255.128 broadcast 185.226.67.255
inet6 fe80::216:3eff:feed:b877 prefixlen 64 scopeid 0x20<link>
ether 00:16:3e:ed:b8:77 txqueuelen 1000 (Ethernet)
RX packets 346609 bytes 38938070 (37.1 MiB)
RX errors 0 dropped 2245 overruns 0 frame 0
TX packets 5994 bytes 579658 (566.0 KiB)
TX errors 0 dropped 0 overruns 0 carrier 0 collisions 0
16. Displaying IPv4 and IPv6 Information
Information about multicast group membership is displayed for both IPv4 and IPv6.
# netstat -g
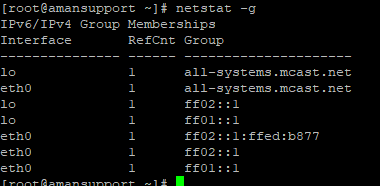
[root@support ~]# netstat -g
IPv6/IPv4 Group Memberships
|
Interface |
RefCnt |
Group |
|---|---|---|
|
lo |
1 |
all-systems.mcast.net |
|
eth0 |
1 |
all-systems.mcast.net |
|
lo |
1 |
ff02::1 |
|
lo |
1 |
ff01::1 |
|
eth0 |
1 |
ff02::1:ffed:b877 |
|
eth0 |
1 |
ff02::1 |
|
eth0 |
1 |
ff01::1 |
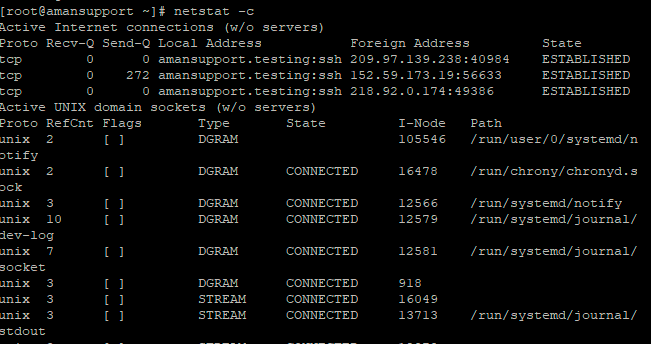
17. Print Netstat Information Continuously
Using the following command will print network statistics every few seconds, so you can get it continuously.
# netstat -c
18. Finding non-supportive Address
Finding un-configured address families with some useful information.
# netstat –verbose
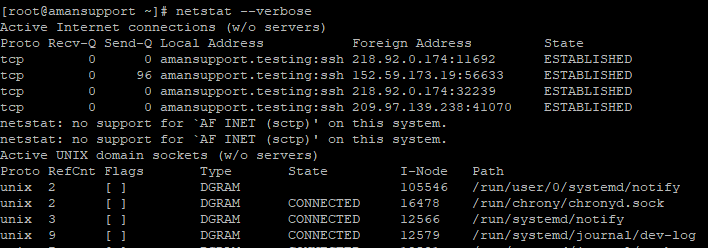
[root@support ~]# netstat –verbose
Active Internet connections (w/o servers)
|
Proto |
Recv-Q |
Send-Q |
Local Address |
Foreign Address |
State |
|---|---|---|---|---|---|
|
tcp |
0 |
0 |
support.testing:ssh |
218.92.0.174:11692 |
ESTABLISHED |
|
tcp |
0 |
96 |
support.testing:ssh |
152.59.173.19:56633 |
ESTABLISHED |
|
tcp |
0 |
0 |
support.testing:ssh |
218.92.0.174:32239 |
ESTABLISHED |
|
tcp |
0 |
0 |
nsupport.testing:ssh |
209.97.139.238:41070 |
ESTABLISHED |
netstat: no support for `AF INET (sctp)’ on this system.
netstat: no support for `AF INET (sctp)’ on this system.
Active UNIX domain sockets (w/o servers)
19. Finding Listening Programs
You can find out how many programs are listening on a port.
# netstat -ap | grep http
tcp 0 0 *:http *:* LISTEN 9056/httpd
tcp 0 0 *:https *:* LISTEN 9056/httpd
tcp 0 0 tecmint.com:http sg2nlhg008.shr.prod.s:35248 TIME_WAIT –
tcp 0 0 tecmint.com:http sg2nlhg007.shr.prod.s:57783 TIME_WAIT –
tcp 0 0 tecmint.com:http sg2nlhg007.shr.prod.s:57769 TIME_WAIT –
tcp 0 0 tecmint.com:http sg2nlhg008.shr.prod.s:35270 TIME_WAIT –
tcp 0 0 tecmint.com:http sg2nlhg009.shr.prod.s:41637 TIME_WAIT –
tcp 0 0 tecmint.com:http sg2nlhg009.shr.prod.s:41614 TIME_WAIT –
unix 2 [ ] STREAM CONNECTED 88586726 10394/httpd
20. Displaying RAW Network Statistics
# netstat –statistics –raw
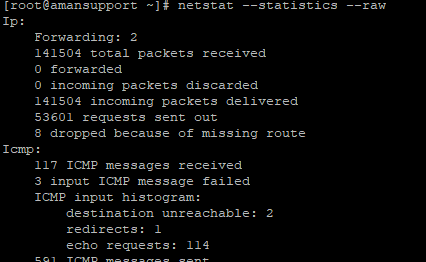
Forwarding: 2
141504 total packets received
0 forwarded
0 incoming packets discarded
141504 incoming packets delivered
53601 requests sent out
8 dropped because of missing route