

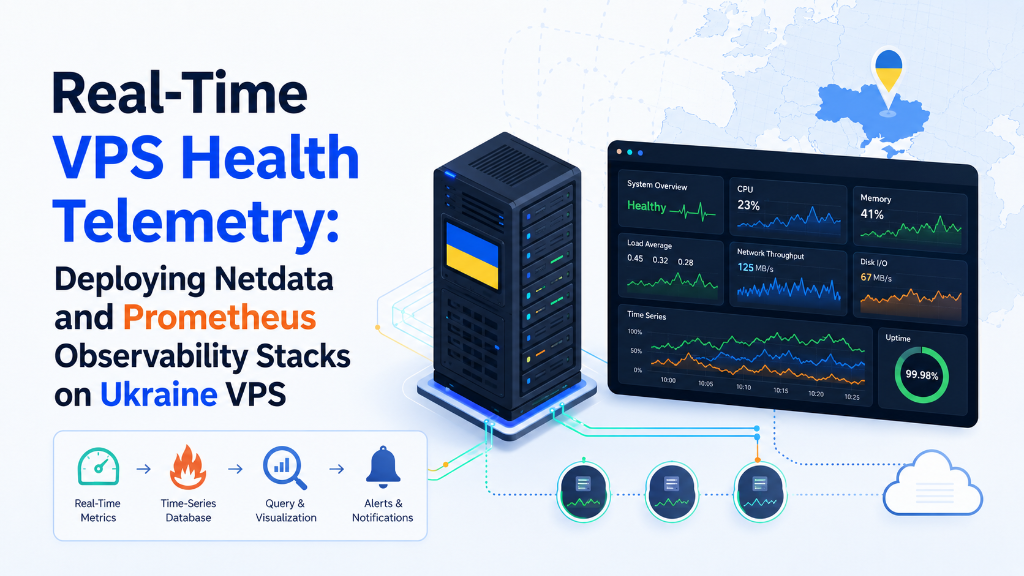
To implement Netdata real-time monitoring VPS telemetry, deploy Netdata for per-second metric streaming alongside Prometheus scraping node_exporter on port 9100. Furthermore, visualize hardware telemetry via Grafana dashboards and configure Alertmanager for automated notifications. Consequently, this architecture captures micro-spikes in CPU steal, RAM pressure, and disk I/O with sub-1% CPU overhead.
Introduction: The Modern Observability Imperative
Consequently, aligning these configurations with your Netdata real-time monitoring VPS environment ensures optimal uptime and throughput. Maintaining high availability and consistent application speed requires deep, continuous visibility into server health. Traditional monitoring systems sample server metrics every 5 minutes. Consequently, they are completely unaware of short micro-bursts of CPU saturation and disk queue stalls.
Strategic Considerations & Architecture Drivers
Specifically, evaluating production infrastructure requirements highlights three critical operational factors:
- Furthermore, The 5-Minute Monitoring Blindspot: Standard monitoring misses transient resource spikes and disk stalls that cause user-facing timeouts.
- High-Resolution 1-Second Telemetry: Netdata provides real-time per-second performance metrics, capturing exact moments of server degradation.
- Consequently, Long-Term Metric Storage & Alerting: Prometheus aggregates historical performance trends and triggers automated alerts to sysadmin teams.
Consequently, aligning these configurations with your Netdata real-time monitoring VPS environment ensures optimal uptime and throughput. In contemporary server engineering, system visibility is the prerequisite for performance reliability, security enforcement, and capacity planning. Modern cloud applications no longer fail through gradual degradation. Instead, web services and database clusters experience sudden failures triggered by transient traffic surges or micro-spikes in CPU steal time. Consequently, disk write locks lasting only a few seconds can bring down an entire production application.
Strategic Considerations & Architecture Drivers
Consequently, aligning these configurations with your Netdata real-time monitoring VPS environment ensures optimal uptime and throughput. Legacy monitoring utilities—such as cron-driven SNMP polls, Nagios 5-minute health checks, or basic cPanel resource gauges—fundamentally ignore these rapid micro-phenomena. When an e-commerce database locks up for 45 seconds, a 5-minute poller averages the spike over 300 seconds. Thus, micro-outages remain hidden. Thus, it falsely reports normal 15% CPU utilization while dozens of transactions abort. Modern DevOps workflows mandate real-time, per-second observability architectures.
To explore enterprise management, review our proactive server monitoring services. Furthermore, our enterprise Linux VPS hosting guide details core virtualization benchmarks.
- ✔ Introduction: The Modern Observability Imperative
- ✔ Architectural Blueprint: Netdata vs Prometheus
- ✔ Step-by-Step Deployment: Installing Netdata on Ubuntu
- ✔ Prometheus Node Exporter Fleet-Wide Aggregation
- ✔ Essential VPS Health Telemetry & Critical Signals
- ✔ Configuring Automated Alerting via Telegram & Webhooks
- ✔ Advanced Metric Scraping & Custom Exporter Pipelines
- ✔ Synthetic Health Probing with Blackbox Exporter
- ✔ Frequently Asked Questions (FAQ)
Architectural Blueprint: Netdata vs Prometheus
In particular, a comprehensive Linux observability stack combines instant real-time telemetry with historical time-series analytics:
A. Netdata Real-Time Engine
Monitors thousands of operating system metrics per second with zero configuration and minimal CPU overhead.
B. Prometheus Time-Series Database
Therefore, scrapes metric endpoints, storing historical performance data for capacity planning and trend analysis.
C. Alertmanager Multi-Channel Routing
Moreover, evaluates alert thresholds and dispatches instant notifications via Slack, Telegram, PagerDuty, or Email.
For comprehensive per-second streaming configuration and alert plugins, refer to the official Netdata documentation.
| Observability Attribute | Netdata Real-Time Daemon | Prometheus + Node Exporter Stack |
|---|---|---|
| Sampling Frequency | 1-second default (sub-second capable) | 10-60 second polling scrape intervals |
| Host Overhead | < 1% CPU, ~100MB RAM (C-native) | Low on exporter; TSDB server requires dedicated RAM |
| Dashboard Configuration | Zero-config auto-discovery (Ready in 60s) | Manual Grafana dashboard & PromQL query design |
| Historical Retention | Hours to weeks (Configurable RAM/disk tiering) | Months to years (Long-term TSDB storage) |
| Kernel eBPF Tracing | Integrated eBPF plugin for socket & VFS calls | Requires external third-party exporters |
Step-by-Step Deployment: Installing Netdata on Ubuntu
Deploying Netdata on a production Linux virtual server requires adhering to security best practices. Specifically, ensure the administrative web interface is strictly restricted behind reverse proxy authentication or firewall boundaries:
Step 1: Automated Kickstart Installation
Similarly, execute the official kickstart script with non-interactive flags to install the native optimized C binary packages without telemetry tracking:
Step 2: Binding Netdata to Localhost Only
By default, Netdata listens on port 19999 across all network interfaces without authentication. To prevent unauthorized reconnaissance of your server metrics, bind the listener strictly to localhost:
Step 3: Configuring Nginx Reverse Proxy with HTTP Basic Authentication
Expose the dashboard securely via an Nginx virtual host with Let’s Encrypt TLS and password protection:
Prometheus Node Exporter Fleet-Wide Aggregation
While Netdata provides granular on-box interactive analysis, Prometheus Node Exporter is the universal standard for fleet-wide metric scraping:
Step 1: Installing Prometheus Node Exporter
Install the official Golang compiled binary directly from the Ubuntu repository. Alternatively, download the latest release from GitHub:
Step 2: Configuring UFW Firewall for Centralized Scrapes
Node Exporter must never be exposed publicly to the global internet. Restrict port 9100 access exclusively to your centralized Prometheus server IP:
Step 3: Prometheus Server Scrape Target Configuration
On your centralized monitoring server, add the Ukraine VPS node target to /etc/prometheus/prometheus.yml:
Essential VPS Health Telemetry & Critical Signals
Monitoring the right metrics distinguishes proactive engineering from reactive chaos. In a virtualized KVM environment, four primary hardware vectors must be tracked continuously:
1. CPU Steal Time (%steal)
In virtualized environments, CPU steal occurs when the host hypervisor delays your vCPU cycles to service neighboring tenants. In Netdata and Prometheus, sustained steal time exceeding 3% indicates host-level oversubscription. Consequently, this signals that workload relocation is urgently required.
2. Linux Pressure Stall Information (PSI)
Rather than watching raw RAM consumption, tracking memory pressure alerts administrators when tasks wait on swap pages. Consequently, operations teams gain 10-15 minutes of advance warning before system degradation occurs.
3. Disk I/O Wait and Queue Depth
High CPU load averages are often misleading. In fact, over 60% of high-load incidents stem not from CPU execution bottlenecks, but from threads waiting on disk operations.
4. Network Interface Socket Drops & TCP Retransmissions
Monitoring TCP retransmission segments exposes routing drops and link congestion. Consequently, teams identify DDoS saturation long before external monitors detect outages.
Configuring Automated Alerting via Telegram & Webhooks
Observability dashboards are ineffective without actionable, high-signal alerts dispatched to real-time notification channels:
Netdata Native Telegram Notifications
Netdata features a built-in alert dispatch engine requiring no external middleware. Configure Telegram bot integration in health_alarm_notify.conf:
Prometheus Alertmanager Rule Definition
Define critical production alert thresholds in /etc/prometheus/alert_rules.yml:
Advanced Metric Scraping & Custom Exporter Pipelines
Beyond standard hardware metrics, production observability architectures often require ingesting custom business and application indicators. Prometheus excels at custom metric collection via textfile collectors and custom client libraries available in Python, Go, Node.js, and Java.
Node Exporter includes a powerful textfile collector flag. Specifically, it allows bash scripts to write metric files in the Prometheus format.
Synthetic Health Probing with Blackbox Exporter
Internal telemetry monitors memory, CPU, and disk statistics from the inside out. However, engineers must also validate external user experience. The Prometheus Blackbox Exporter probes endpoints over HTTP, HTTPS, DNS, TCP, and ICMP from remote geographic viewpoints.
Pairing Netdata with an external Blackbox exporter provides end-to-end visibility. For instance, if Nginx serves HTTP 500 errors while CPU usage remains low, the framework flags the outage immediately. Therefore, engineers receive actionable alerts within 15 seconds.
Frequently Asked Questions (FAQ)
Metric Telemetry & Polling Architecture FAQ
Explore essential questions and architectural best practices for this deployment on Ukraine VPS:
Q
How does Netdata’s 1-second metric polling engine operate with zero disk database overhead on Linux VPS?
How does Netdata’s 1-second metric polling engine operate with zero disk database overhead on Linux VPS?
Netdata uses an in-memory round-robin database that retains 1-second telemetry directly in RAM. Thus, it updates graphs instantly without generating disk write operations.
Q
Why is 1-second metric polling superior to traditional 5-minute polling?
Why is 1-second metric polling superior to traditional 5-minute polling?
Traditional 5-minute monitoring is unaware of short micro-bursts of CPU saturation. In contrast, per-second polling immediately detects transient memory spikes and disk stalls. Per-second telemetry reveals the exact second bottlenecks occur.
Q
What is CPU Steal Time (`%steal`) and how do you monitor it?
What is CPU Steal Time (`%steal`) and how do you monitor it?
CPU steal time occurs when the physical hypervisor CPU services other guests. Therefore, your virtual machine must wait to execute instructions. Netdata and Prometheus track `%steal`; values above 3–5% indicate hypervisor over-subscription.
Q
How do you secure Prometheus and Netdata web dashboards on a VPS?
How do you secure Prometheus and Netdata web dashboards on a VPS?
Bind Netdata and Prometheus to localhost and access them via an SSH tunnel. Alternatively, configure Nginx as a reverse proxy with Basic Authentication and SSL.
Deployment, Alerts & Operational Inquiries
Q
Can Prometheus alert sysadmins via Telegram, Slack, or Email?
Can Prometheus alert sysadmins via Telegram, Slack, or Email?
Yes. Pairing Prometheus with Alertmanager allows you to define threshold alert rules. In fact, instant notifications dispatch to Slack, Telegram, or PagerDuty whenever limits are breached.
Q
What is the CPU and memory footprint of running Netdata agent on a VPS?
What is the CPU and memory footprint of running Netdata agent on a VPS?
Netdata is engineered in optimized C and utilizes under 1% of a CPU core and 50–100MB of RAM. Thus, it runs smoothly even on modest 1GB VPS instances.
Q
How do you scrape Netdata real-time metrics directly into Prometheus?
How do you scrape Netdata real-time metrics directly into Prometheus?
Netdata features an embedded Prometheus exporter endpoint at port 19999. Simply add this target endpoint to your prometheus.yml scrape configuration to ingest high-frequency metrics.
Q
How does Grafana integrate with Prometheus for historical health dashboards?
How does Grafana integrate with Prometheus for historical health dashboards?
Grafana connects to Prometheus as a standard time-series data source. Consequently, you can import curated dashboards for visual trend analysis and capacity planning.
Executive Summary: Production Observability & Telemetry Architecture
