

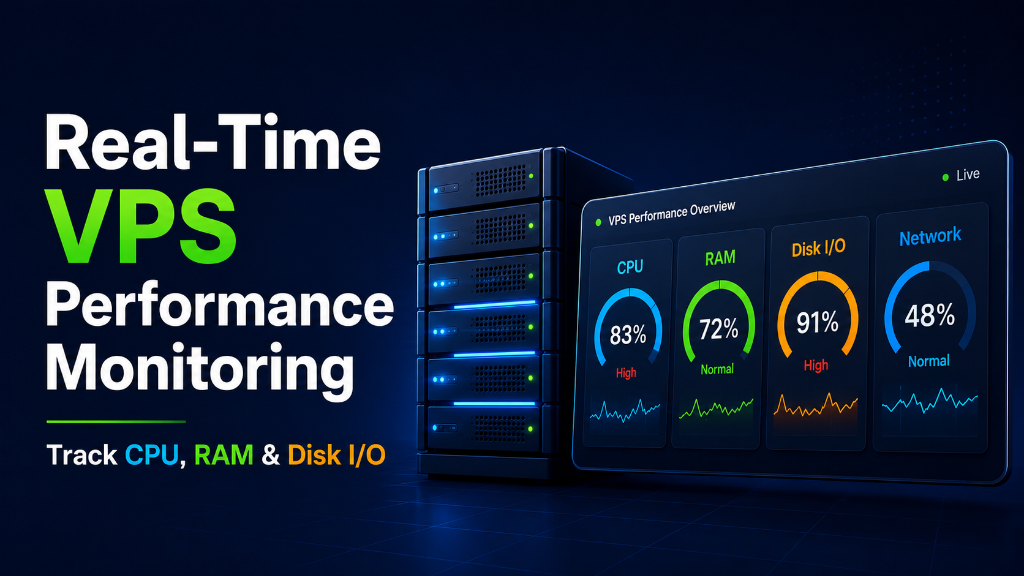
The recommended Linux VPS monitoring stack combines Netdata for high-frequency (1-second) live metric visualization with Prometheus for persistent time-series data storage and long-term trend analysis. Connect Grafana to Prometheus to build customizable operational dashboards and set up Alertmanager to dispatch automated notifications on threshold alerts.
Introduction: Moving from Reactive Firefighting to Proactive Server Observability
In high-availability web operations, waiting for users or client support tickets to notify you that your website is down is a catastrophic operational failure. Production servers do not fail instantly without warning; they exhibit measurable symptoms hours or days in advance: gradual memory leaks, creeping disk I/O queue depths, unindexed database query pileups, and CPU steal contention. Proactive telemetry detection allows engineers to remediate issues before users notice slowdowns.
Strategic Considerations & Core Architecture Drivers
Without comprehensive real-time performance monitoring tools, system administrators operate in the dark, struggling to diagnose whether a sudden spike in latency is caused by a DDoS attack, a rogue PHP worker process, or hypervisor CPU contention from neighboring virtual machines.
Modern DevOps engineering demands a two-tiered observability framework: high-resolution real-time diagnostic agents (Netdata) for sub-second live troubleshooting, paired with centralized long-term time-series metric platforms (Prometheus + Grafana) for multi-server fleet telemetry, capacity planning, and automated threshold alerting.
Furthermore, integrating low-level Linux CLI diagnostic utilities (such as iostat, iotop, and vmstat) empowers engineers to pinpoint the exact processes consuming disk IOPS or locking kernel memory structures in seconds.
By constructing automated alerting pipelines via Prometheus Alertmanager, teams receive proactive warnings on Slack or PagerDuty before disk partitions fill or memory exhaustion triggers kernel Out-Of-Memory terminations.
Deploying on unmetered USA VPS hosting provides high-performance computing cores and unthrottled network bandwidth to stream telemetry seamlessly. In this comprehensive technical guide, we evaluate monitoring architectures, compare observability platforms, analyze Linux kernel diagnostic metrics, and deliver an actionable PuTTY setup runbook.
Architectural Models: Netdata Real-Time Profiling vs. Prometheus & Grafana Fleet Telemetry
Comparing instant per-second local diagnostics against distributed time-series metrics platforms clarifies how modern observability stacks are constructed.
For time-series metric collection and PromQL querying syntax, consult the official Prometheus documentation.
|
Live Sub-Second Profiling
Netdata Real-Time AgentZero-config local agent. Captures 1-second metric resolution, live eBPF kernel tracing, per-process CPU/disk usage, and instant anomaly charts. Best For: Live incident debugging & root-cause diagnosis.
|
Centralized Observability
Prometheus & Grafana StackPull-based metric scraper (Node Exporter), PromQL time-series database, multi-server Grafana dashboards, and Alertmanager incident routing. |
Core Concept: The 5 Fundamental Linux Performance Metrics
Every systems administrator must master these five critical Linux kernel telemetry metrics:
Establishing automated threshold alerts across multi-server environments is covered in our complete guide to server setup, system monitoring, and health checks.
1. CPU Load Average vs. Core Capacity
The Linux load average (reported over 1, 5, and 15 minutes) represents the average number of processes in a runnable or uninterruptible disk-sleep state. On a 4-vCPU server, a load average of 4.0 indicates 100% capacity utilization. A load average exceeding 8.0 indicates significant process queuing and immediate latency degradation.
2. CPU Steal Time (%st) and Hypervisor Contention
In virtualized cloud environments, CPU Steal Time (%st) measures the percentage of time your virtual CPU was ready to execute instructions but was forced to wait because the physical hypervisor was serving other virtual machines. A steal time consistently above 3%–5% indicates an oversold host node and severe noisy-neighbor contention.
3. Memory Working Sets: Buffer, Cache & Swap Activity
In Linux, ‘free’ RAM is wasted RAM; the kernel automatically uses unused memory for disk caching (buff/cache). When monitoring memory, focus on Available Memory (memory instantly reclaimable without swapping) and Swap In/Out rates (si / so in vmstat). Active swap paging directly destroys database query performance.
4. Disk I/O Wait (%iowait) & Storage Await Latency
%iowait measures the time CPU cores remain completely idle waiting for disk reads/writes to complete. Storage latency (await in iostat) measures average I/O transaction duration. On enterprise NVMe storage, await should remain below 1.5ms. An await exceeding 15ms indicates extreme disk queue bottlenecks.
5. TCP Socket States & SYN Queue Backlogs
High-traffic web servers can exhaust network socket handles. Monitoring TCP connection states via ss -s tracks active ESTAB, TIME-WAIT, and pending SYN-RECV queues. A massive surge in TIME-WAIT sockets indicates unoptimized HTTP keepalive settings or high-frequency backend connection churn.
6. Log Aggregation & Correlation via Grafana Loki
Metrics tell you *that* a server is failing; log files tell you *why*. Integrating Grafana Loki with Promtail streams Nginx, MySQL, and systemd journal logs into Grafana dashboards, allowing engineers to correlate CPU spikes directly with specific application error traces in a single split-screen UI.
7. Synthetic Endpoint Uptime & Blackbox Probing
Internal server metrics must be validated with external synthetic testing. The Prometheus Blackbox Exporter polls public HTTP endpoints, DNS nameservers, and TCP ports from external geographic locations every 15 seconds, measuring SSL certificate expiration dates and true external Time To First Byte (TTFB).
8. Application Performance Monitoring (APM) & OpenTelemetry
While OS metrics reveal system-level resource pressure, OpenTelemetry APM traces individual code execution pathways across microservices. By instrumenting PHP, Node.js, or Python runtimes, APM highlights exact function execution durations, external API call latencies, and slow database queries within individual web transactions.
9. Kernel Latency Histograms via eBPF BCC Tools
Traditional tools like top show average values that hide short, microsecond latency spikes. Modern Linux systems utilize eBPF (Extended Berkeley Packet Filter) BCC tools (such as biolatency and execsnoop) to record nanosecond-level histograms of disk I/O requests and process spawning events directly inside the kernel ring.
10. Hardware Health & NVMe S.M.A.R.T. Telemetry
Storage devices degrade gradually over millions of write cycles. Integrating smartctl and Prometheus node-exporter textfile collectors tracks NVMe percentage used, available spare blocks, and thermal throttle events, alerting operations teams to replace failing storage arrays long before read/write errors occur.
Server Monitoring Tools & Telemetry Platforms Comparison
Compare the top open-source and enterprise performance monitoring platforms:
| Monitoring Platform | Telemetry Type | Metric Resolution | Resource Footprint | Optimal Use Case |
|---|---|---|---|---|
| Netdata | Real-Time Agent + eBPF | 1 Second | ~1% CPU, 100MB RAM | Live incident diagnosis |
| Prometheus + Grafana | Time-Series Scraper (TSDB) | 10–60 Seconds | Moderate (Central Server) | Fleet telemetry & alerting |
| Glances | CLI / Web Interface | 2–5 Seconds | Lightweight Python | Quick terminal overview |
| Zabbix | SNMP / Agent Monolith | 60 Seconds | High (Relational DB) | Legacy enterprise fleets |
| Datadog (SaaS) | Cloud SaaS Agent + APM | 10–15 Seconds | $15–$30/host/month | Enterprise hybrid clouds |
Real-World Scenarios: Incident Prevention via Monitoring Stacks
Review how performance monitoring prevents costly downtime across real-world business environments:
🛒 E-Commerce Flash Sales
Track PHP-FPM active process counts and MySQL buffer hit rates in real time, automatically scaling worker pools before checkout checkout slowdowns.
🏢 Multi-Tenant Hosting Fleets
Monitor 50+ VPS instances from a single Grafana pane, pinpointing rogue tenants causing disk I/O spikes or saturating network bandwidth.
⚙️ CI/CD Build Runners
Detect Docker container memory leaks and disk space exhaustion during heavy automated integration testing runs.
📰 High-Traffic Media Outlets
Monitor Nginx connection states and Redis cache eviction rates to maintain sub-50ms TTFB during breaking news traffic surges.
Hands-On Implementation: Deploying Prometheus, Grafana & Netdata (PuTTY Terminal Guide)
Execute these production commands directly in your PuTTY terminal to install Netdata, deploy Prometheus Node Exporter, configure Grafana dashboards, and audit disk I/O bottlenecks:
Capturing low-overhead kernel histograms with eBPF tools is especially valuable on high-performance Linux VPS hosting for demanding applications processing intensive background jobs.
Step 1: Install Netdata Real-Time Performance Agent
Deploy kickstart installer for zero-config 1-second metric streaming on port 19999:
Step 2: Install Prometheus Node Exporter on Monitored VPS Nodes
Expose Linux hardware and OS metrics on port 9100 for Prometheus scraping:
Step 3: Configure Prometheus Metric Scrape Targets (/etc/prometheus/prometheus.yml)
Define scrape intervals and target VPS instances in central Prometheus configuration:
Step 4: Deploy Grafana Dashboard & Connect Prometheus Data Source
Install official Grafana server and import standard Linux Host Dashboard (ID: 1860):
Step 5: Live Disk I/O & Process Troubleshooting via iostat & iotop
Identify exact disk saturation and offending PID write processes:
Step 6: Audit Kernel Memory & Context Switches via vmstat CLI
Trace memory pressure, page faults, and swap activity in real time:
Step 7: Trace Kernel Block I/O Latency Histograms via eBPF BCC
Install BCC tools and record microsecond block device latency distribution:
Step 8: Audit Physical NVMe Drive Health via smartctl CLI
Query NVMe wear endurance percentages and temperature status:
Always set up a Prometheus alert for rate(node_cpu_seconds_total{mode="steal"}[5m]) > 0.05. If steal time exceeds 5% on your VPS, it proves your host node is overcommitted, giving you clear evidence to request a migration to a less crowded hypervisor node.
Never leave Node Exporter (port 9100), Netdata (port 19999), or Prometheus (port 9090) open to the public internet without authentication. Exposing these ports leaks detailed internal infrastructure metrics, system usernames, and active process trees to adversaries. Restrict access strictly via UFW firewall allowlists, VPNs, or Nginx reverse proxies with SSL client certificates.
Frequently Asked Questions (FAQ)
Explore essential questions and architectural best practices for this deployment on Ukraine VPS:
VPS Performance Monitoring Tools: Executive Summary
%st), Memory Working Sets, and Disk I/O Wait (%iowait) to detect bottlenecks before service degradation occurs.
