

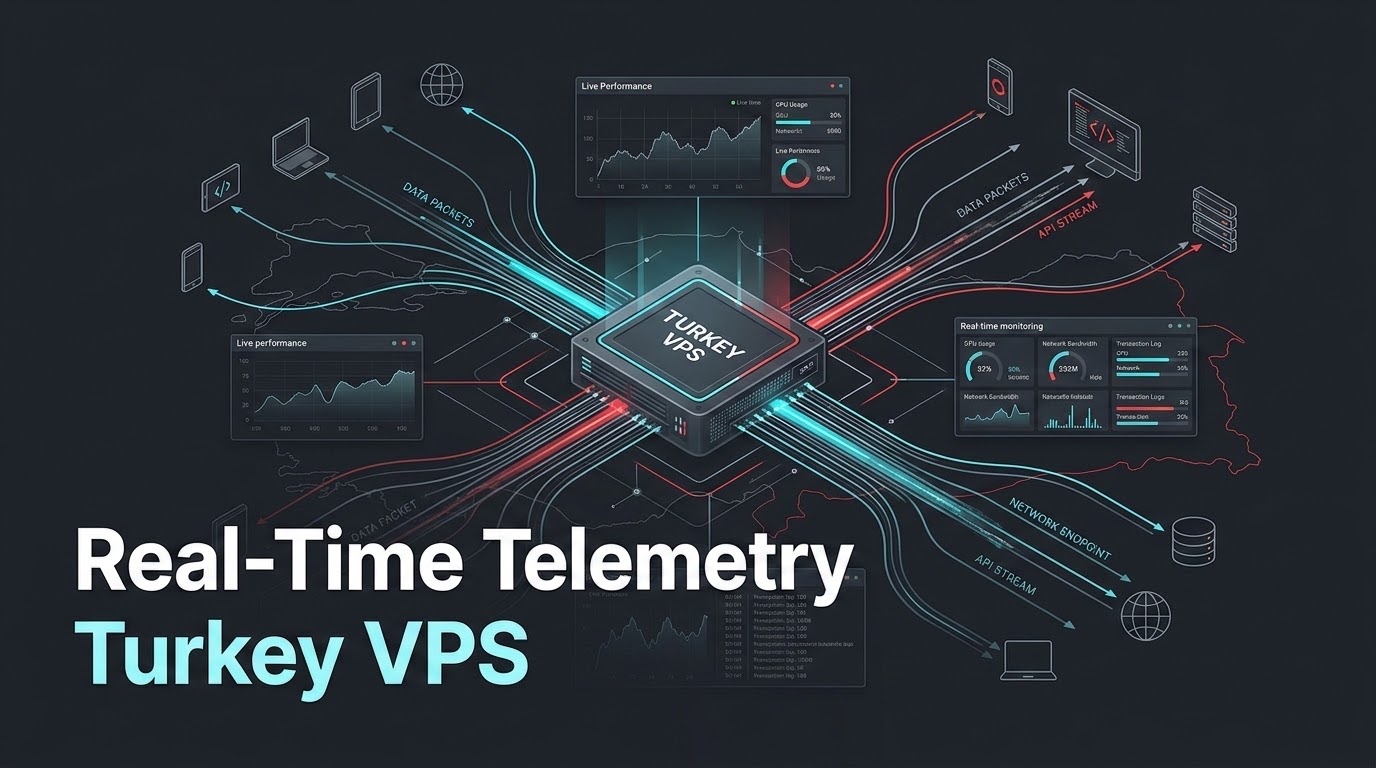
When planning an enterprise deployment for real time telemetry Turkey VPS, deploying real-time monitoring on an Istanbul cloud VPS combines Netdata (for per-second kernel and container diagnostic metrics) with Prometheus and Node Exporter (for historical time-series storage and alerting). Synchronizing server system clocks, syslog timestamps, and alerting schedules to Turkey Time (TRT / UTC+3) ensures operational alignment with local business hours and traffic patterns. Connecting telemetry alerts to Telegram or Slack allows DevOps teams to detect memory leaks, I/O saturation, and DDoS anomalies before client-facing service disruption occurs.
Specifically, in high-availability web operations, reactive infrastructure management—relying on angry customer phone calls or payment gateway failure notifications to realize that a database has crashed—is a recipe for commercial disaster. Modern enterprise architectures demand continuous, high-resolution observability into physical CPU cycles, memory allocation thresholds, storage I/O wait times, and network socket exhaustion. Deploying on monitored Turkey cloud VPS hosting instances in Istanbul data centers ensures that technical leads and Site Reliability Engineers (SREs) maintain comprehensive operational transparency, protecting business revenue across Turkish domestic telecom networks.
✔ Key Architectural Takeaways
- High-Resolution Observability: Netdata provides real-time 1-second metric resolution with negligible CPU consumption (less than 1% of a single vCPU core) and zero external database dependencies.
- Furthermore, Time-Series Metric Archiving: Prometheus with Node Exporter stores long-term historical operational trends, enabling predictive capacity planning and seasonal traffic forecasting.
- Consequently, Turkey Time (TRT / UTC+3) Alignment: Synchronizing server clocks and alert silences to Europe/Istanbul ensures on-call alerts align with actual Turkish business operating hours and prevent unnecessary overnight escalations.
- In addition, Actionable Telemetry Thresholds: Real-time alerts should trigger on predictive bottlenecks: RAM usage exceeding 88%, NVMe write latency spiking over 45ms, or TCP connection backlogs approaching max socket capacity.
- In particular, Zero-Cost ChatOps Integration: Automated alerting pipelines route warning and critical incident payloads directly to private Telegram bot channels or Slack webhooks in real time.
Table of Contents
- Why Reactive Monitoring Fails on Turkey VPS
- Time Synchronization in TRT Timezone (UTC+3)
- Deploying Netdata with Zero Agent Bloat
- Prometheus & Node Exporter Stack Setup
- Defining Critical Incident Thresholds
- Automating Incident Alerts via Telegram
- Netdata vs. Prometheus vs. Zabbix Comparison
- Production Telemetry Stack Runbook
- Frequently Asked Questions (FAQ)
Why Reactive Monitoring Fails on Turkey VPS
Furthermore, in standard web hosting environments, administrators often rely on coarse 5-minute polling checks performed by external ping monitors. While an external HTTP check confirms whether your homepage is returning a 200 OK status code, it provides zero visibility into underlying resource exhaustion. A memory leak in a background worker daemon or a cascading lock contention in MySQL can develop and crash the server between two 5-minute polling intervals.
Consequently, real-time telemetry shifts infrastructure operations from reactive incident response to proactive issue prevention. High-resolution telemetry tools capture operating system metrics every second. When storage write latency begins to climb from 2ms to 45ms during an unindexed batch database update, or when PHP-FPM worker pools saturate to 95% capacity, real-time alerts fire immediately. Systems engineers can intervene, kill runaway queries, or adjust memory allocations long before an actual outage impacts Turkish customers.
Time Synchronization in TRT Timezone (UTC+3)
Accurate log correlation and telemetry graphing require microsecond clock precision. In 2016, Türkiye permanently abolished Daylight Saving Time, fixing national time at a permanent UTC+3 offset (officially designated as Turkey Time – TRT). If your Istanbul cloud VPS defaults to UTC or an outdated European daylight-saving timezone, server logs, cron backups, and Prometheus incident timestamps become misaligned with regional user traffic patterns.
In addition, ensure your Linux operating system is pinned permanently to the Istanbul timezone and synchronizes with regional NTP time servers using chrony:
Verifying that timedatectl reports Time zone: Europe/Istanbul (+03, +0300) guarantees that all metrics, audit trails, and automated backups execute in perfect harmony with Turkish financial, banking, and e-commerce business cycles.
Deploying Netdata with Zero Agent Bloat
In particular, Netdata is the gold standard for real-time Linux performance troubleshooting. Engineered in highly optimized C, Netdata monitors thousands of system metrics per second—including per-core CPU cycles, memory page faults, disk queue depths, TCP socket states, and container statistics—while consuming less than 1% of a single vCPU core and approximately 80MB of RAM.
Therefore, unlike traditional monitoring software that requires setting up external databases like Elasticsearch or MySQL, Netdata writes metrics to an internal in-memory ring buffer with circular storage. It features a stunning, zero-configuration web dashboard that renders real-time interactive charts directly inside your browser. Netdata is ideal for spotting instantaneous performance anomalies, such as CPU throttle spikes or network packet drops across Turkish telecom interfaces. Structuring time-series telemetry with distinct metric names and key-value label dimensions conforms to the Prometheus official metric data model documentation.
Prometheus & Node Exporter Stack Setup
While Netdata excels at real-time, in-the-moment troubleshooting, Prometheus serves as the industry standard for long-term time-series metric aggregation, capacity planning, and multi-server fleet management:
- Moreover, Node Exporter: A lightweight Go daemon running on the host that exposes hundreds of hardware and kernel metrics over an HTTP endpoint (
http://localhost:9100/metrics). - In fact, Prometheus Server: A time-series database engine that scrapes Node Exporter endpoints on configurable intervals (e.g., every 15 seconds), storing historical data points in compressed, append-only time-series blocks.
- Similarly, Alertmanager: An integrated notification router that evaluates metric rules against Prometheus data and dispatches deduplicated alerts to webhooks, PagerDuty, or chat applications.
Meanwhile, combined with Grafana, the Prometheus ecosystem allows technical teams to build executive-level dashboards tracking monthly bandwidth consumption, database growth projections, and e-commerce transaction velocity across multiple Istanbul cloud nodes.
Defining Critical Incident Thresholds
Additionally, configuring effective telemetry requires defining actionable thresholds. Generic alerts that fire constantly create “alert fatigue,” causing engineers to ignore critical warnings. For cloud VPS instances hosted in Istanbul, focus your alerting engine on these four mission-critical hardware metrics:
| System Metric | Warning Threshold | Critical Threshold | Operational Diagnosis |
|---|---|---|---|
| RAM Utilization | > 82% for 5 min | > 92% for 2 min | Memory leak in PHP/Node worker; risk of kernel OOM killer |
| CPU Steal Time (%steal) | > 5% for 3 min | > 12% for 1 min | Underlying hypervisor noisy neighbor; host node oversubscription |
| NVMe Disk Await Latency | > 25 ms | > 55 ms | Storage queue saturation; slow database queries locking tables |
| TCP Conntrack Sockets | > 75% capacity | > 90% capacity | SYN flood attack or unclosed backend database socket leaks |
| Disk Space Usage | > 80% capacity | > 90% capacity | Unrotated system logs, bloated database binlogs, or backup dumps |
As a result, onliveServer KVM cloud instances provide dedicated virtual CPU execution with zero CPU steal time, ensuring predictable execution regardless of neighboring tenant activities.
Automating Incident Alerts via Telegram
Specifically, telegram is one of the most widely used messaging applications across the Turkish technology and startup community. Establishing an automated incident alert pipeline to a private Telegram channel allows engineering leads to receive instant, actionable notifications directly on their mobile phones.
Deploy the following lightweight monitoring and alerting script that checks memory, disk space, and load averages every 60 seconds, dispatching an immediate Telegram alert when critical thresholds are exceeded:
Add this script to your root crontab (* * * * * /opt/scripts/vps_telemetry_alert.sh) to ensure your infrastructure is protected by an autonomous 24/7 monitoring sentinel.
Netdata vs. Prometheus vs. Zabbix Comparison
The comparative matrix below illustrates the trade-offs between the primary server monitoring solutions available for Linux cloud instances:
| Evaluation Feature | Netdata | Prometheus + Node Exporter | Zabbix 7.0 |
|---|---|---|---|
| Metric Resolution | 1-Second Granularity | 10 – 30 Second Intervals | 1 – 5 Minute Polling |
| Host Resource Overhead | Very Low (< 1% CPU, 80MB RAM) | Low (< 1% CPU, 25MB RAM) | High (Requires SQL DB + PHP) |
| Setup Complexity | Zero-Config (1-liner curl script) | Moderate (Config YAML files) | Complex (Full database install) |
| Historical Data Archiving | Short to Medium (In-memory ring) | Long-term (Years with TSDB) | Long-term (SQL database) |
| Ideal Deployment Scenario | Single VPS live debugging | Multi-server microservice fleets | Large legacy enterprise IT |
Production Telemetry Stack Runbook
To deploy Netdata on your Ubuntu 24.04 LTS Turkey VPS with immediate local web dashboard access, execute the official non-intrusive kickstart script:
Binding Netdata to 127.0.0.1 and tunneling via SSH guarantees that your sensitive internal server performance metrics remain completely shielded from public Internet scanners while providing you with high-speed 60fps telemetry dashboards.
Frequently Asked Questions (FAQ)
Core Technical Specifications
Does running Netdata slow down websites hosted on the same VPS?
No. Netdata is written in highly optimized C and operates with kernel-level zero-copy telemetry collectors. It consumes less than 1% of a single CPU core and operates with a polite process priority (nice level 19), ensuring web server processes always take precedence.
Why is setting the timezone to Europe/Istanbul so critical for servers in Turkey?
Türkiye operates on permanent UTC+3 (TRT) without seasonal daylight saving shifts. If server clocks default to UTC or European timezones, automated backup windows, billing cron jobs, and error logs will be offset by 3 hours, causing confusion during incident troubleshooting and audit reviews. When diagnosing metric spikes related to PHP-FPM worker exhaustion and buffer saturation, see our guide on troubleshooting 502 and 504 gateway errors on Turkey VPS.
What is CPU steal time (%steal), and why does it matter on cloud servers?
CPU steal time measures the percentage of time a virtual machine wants to execute instructions but is forced to wait because the physical hypervisor CPU is occupied by other neighboring virtual machines. High steal time indicates host oversubscription. OnliveServer guarantees zero CPU steal time on enterprise KVM nodes.
Can I monitor multiple Turkey VPS instances in a single Grafana dashboard?
Yes. By deploying Node Exporter on each Turkey VPS and configuring a central Prometheus instance to scrape each node, Grafana can aggregate metrics across all your production, staging, and database servers into a unified, single-pane-of-glass dashboard.
How do I monitor MySQL and MariaDB slow queries in real time?
Both Netdata and Prometheus include dedicated MySQL/MariaDB collector plugins. By enabling the slow query log (slow_query_log = 1 and long_query_time = 1), the telemetry agent tracks query execution duration, unindexed table scans, and lock waits in real time.
Can Telegram alerts handle multiple administrators on an on-call rotation?
Yes. Instead of sending alerts to an individual user ID, you can create a private Telegram group containing your entire engineering team, add your monitoring bot as an administrator, and route alerts to the group’s Chat ID. All engineers receive instant notifications simultaneously.
How much disk space does Prometheus historical metric storage require?
Prometheus employs highly efficient delta-of-delta and XOR chunk compression. Storing 1,000 metrics scraped every 15 seconds consumes approximately 1.5 to 2 bytes per sample, requiring roughly 10GB to 15GB of disk storage per year of continuous historical retention.
Does OnliveServer provide managed 24/7 monitoring services?
Yes. In addition to self-hosted telemetry tools, OnliveServer managed cloud tiers include external hypervisor-level telemetry monitored 24/7/365 by our Istanbul data center engineering team, backed by guaranteed 15-minute emergency intervention SLAs.
Gain Complete Observability over Your Istanbul VPS
Eliminate midnight panics with real-time telemetry, sub-second Netdata diagnostics, and 24/7 proactive infrastructure management on enterprise NVMe hardware.
